 RealPage · AI & Analytics
More data was never the answer. Better direction was.
Lumina Analytics is a next-generation strategic analytics engine for property owners and operators — one that replaces dozens of disconnected dashboards with a small set of outcome-tied signals and an always-on AI analyst. I led the UX, defining the signal model, the screens, and the conversational layer.
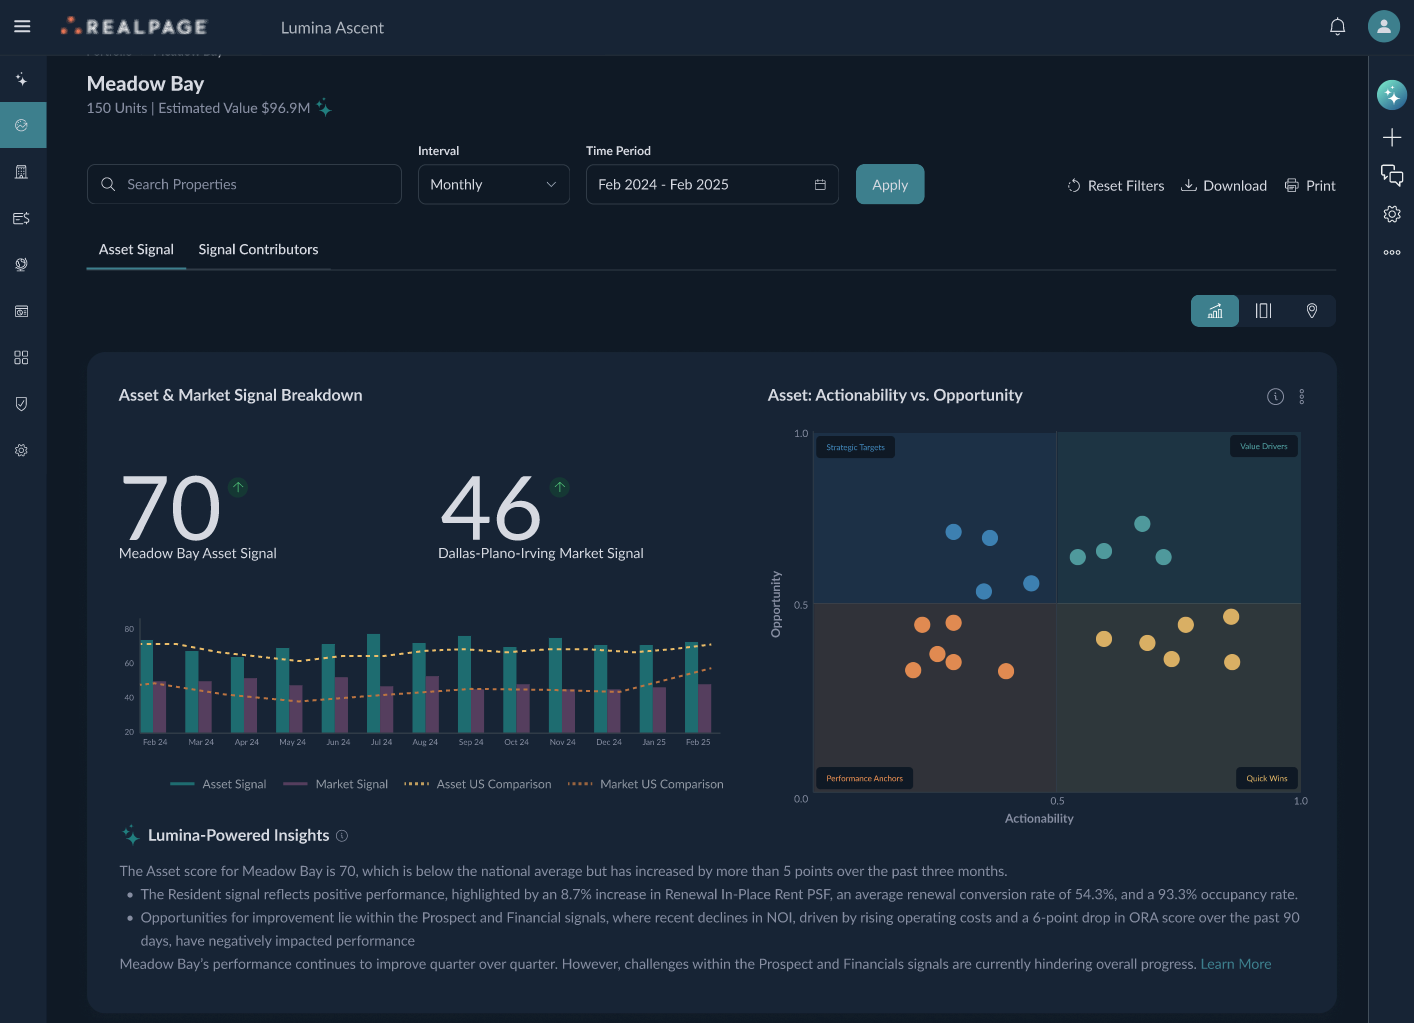
Asset Signal — a single score with the market context, signal breakdown, and an actionability-vs-opportunity view that tells operators where to act first.
Operators were drowning in dashboards, starving for direction.
Property teams already had more data than they could use. What they lacked was prioritization — a way to know, on any given morning, which asset needed attention and why. Today's analytics reality fought them on three fronts.
More data wasn't going to fix it. The job was to turn measurement into a clear, defensible next move — and to do it in a way a regional manager could trust in a high-stakes moment.
Too much noise.
Endless KPIs with no prioritization, and dozens of dashboards — none of them delivering clarity on what to do next.
Disconnected tools.
Fragmented systems and manual reporting meant teams spent hours assembling answers before they could even start deciding.
Reactive by design.
Delayed insights and lagging indicators pushed people toward gut-driven decisions exactly when the stakes were highest.
Six signals instead of a thousand metrics.
The core UX bet was to collapse the metric sprawl into Performance Signals — a small, consistent vocabulary that rolls every asset up into outcome-tied scores, each explainable down to its drivers.
Asset
A single signal for each property, built from the drivers below it.
Portfolio
Your entire business, rolled up into one comparable view.
Acquire
Demand generation and conversion across the funnel.
Retain
Retention and resident satisfaction signals.
Margin
NOI and controllable spend, surfaced as a signal.
Market
External forces shaping future potential and risk.
Why it mattered: every signal had to be both rolled-up enough to scan a portfolio at a glance and decomposable enough to defend a decision. That tension — one number you can trust, with the drivers always one tap away — set the design constraints for every screen that followed.
Making a score you can argue with.
A signal nobody trusts is just another KPI. The hard part wasn't the number — it was designing the path from score to driver to action so a skeptical operator could interrogate it and come away convinced.
Another dashboard of charts
- More panels add measurement, not prioritization.
- Leaves the “so what” entirely to the user.
- No shared language across web, mobile, and the agent.
Signal → drivers → action
- An actionability-vs-opportunity quadrant ranks where to act.
- Every score opens into the drivers — Prospect, Resident, Financial.
- Lumina-powered insights explain the “why” in plain language.
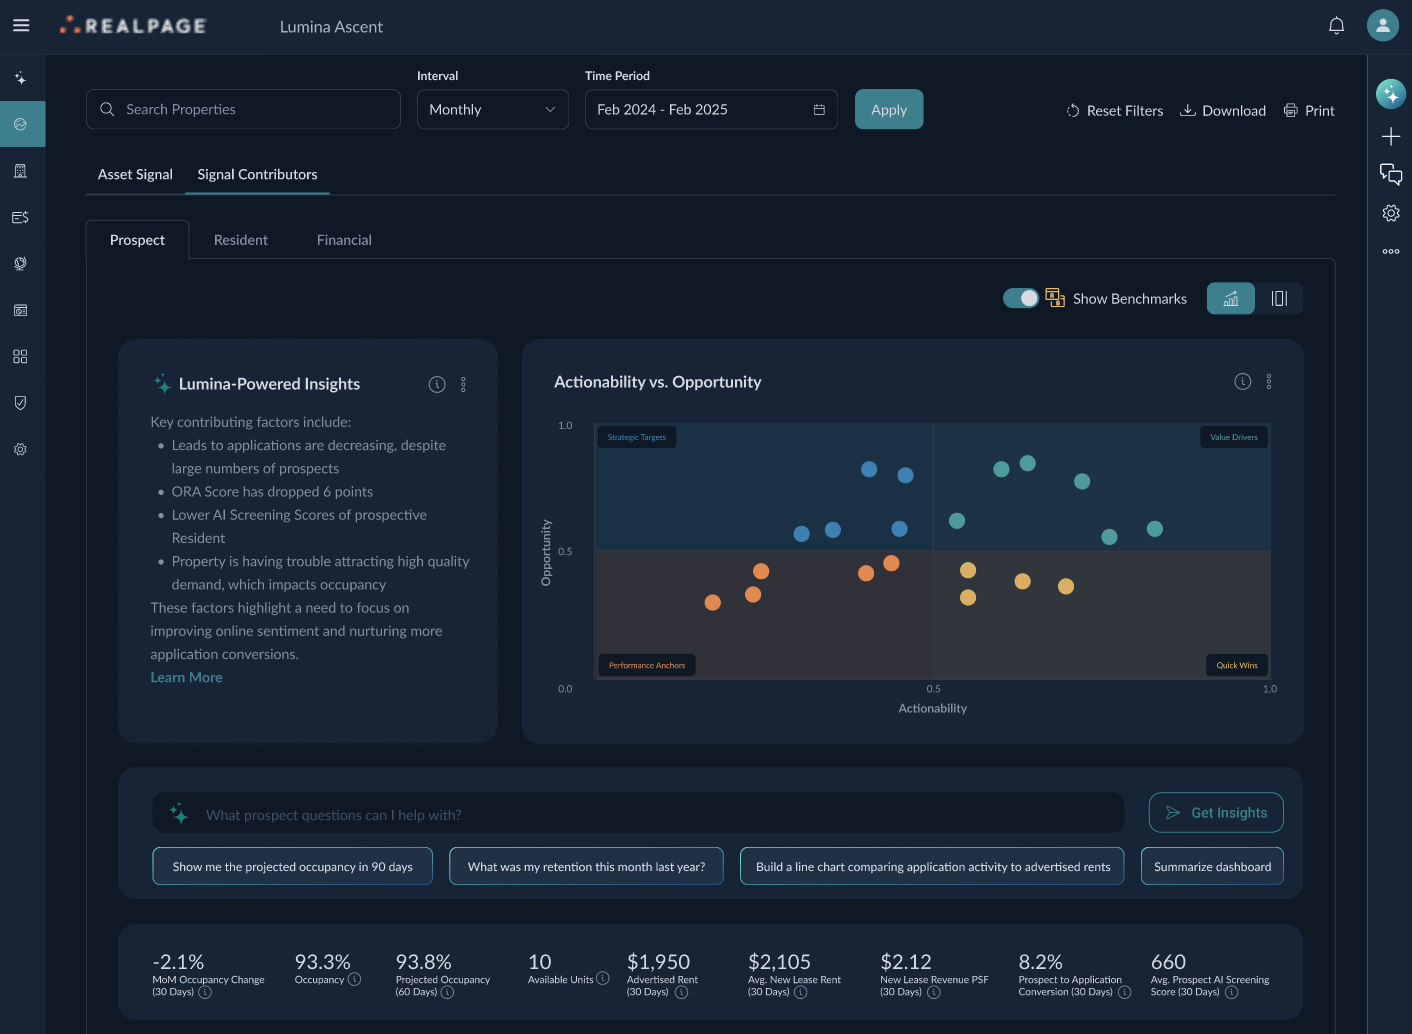
Signal Drivers — Prospect, Resident, and Financial contributors behind each score, with benchmarked metrics and AI-written context.
An always-on analyst, in the same product.
The signals tell you where to look. The AI Analytics Agent lets you ask why, get it explained, and see it visualized — without leaving the workflow or waiting on a report.
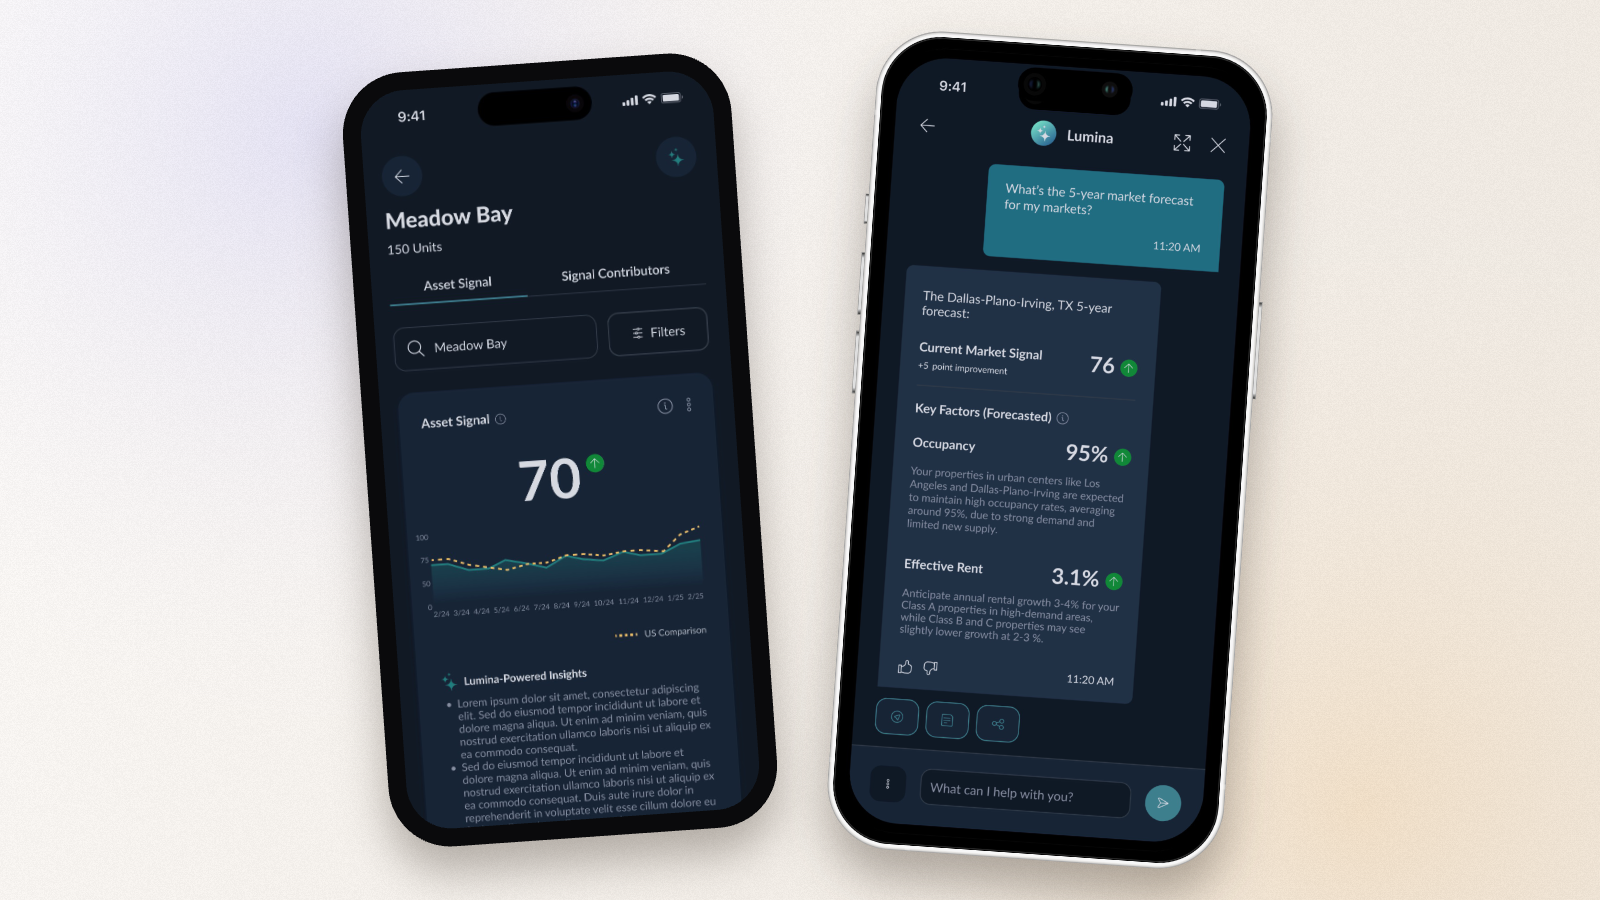
The same signal model travels from desktop to mobile to a conversational agent — ask in natural language, get a narrated answer with the numbers behind it.
Conversational Analytics
Ask in natural language to explore trends, drivers, and opportunities — your always-on analyst for faster, smarter insights.
Narrative Summarization
Auto-generated written commentary that explains what the data actually means, not just what it shows.
Visual Creation
Instantly generate tailored charts and graphs on demand, built from the same governed signals.
Now proving it with customers — the Lumina Ascent beta.
Rather than ship and hope, the work moves into a structured beta — Lumina Ascent — with real partner data loaded across five properties spanning multiple markets and performance profiles, to validate that the signals surface the right actions.
- What the beta is built to measure:
- Whether the interface surfaces actionable insights quickly, and is genuinely easy to use.
- That Lumina solves a core business problem — not just a reporting one.
- Enough confidence and value for partners to commit to Beta 2.
What I'm watching for
The risk with an outcome score isn't accuracy — it's trust. If an operator can't trace a signal back to a driver they recognize, the number gets ignored no matter how good the model is. So the thing I'm most focused on in beta is the explainability path: how often people actually open the drivers, where the narrative earns trust, and where it still reads like a black box. That feedback, not the launch, is the real design milestone.